Translate

Featured Post

Welcome!

We are the writers of "The 9-3 Putout" and we will be writing articles about all facets of baseball, from the current game to the ...

Showing posts with label pitching. Show all posts

Sunday, June 30, 2019

Trying to Make Peace with WAR

There’s been rich discussion in the baseball community about the ethics of the analytical revolution over the past several decades, accentuated and explored by the book/movie Moneyball.  Whether you agree with the philosophies of the statistic or not, Wins Above Replacement (or WAR) is the best publicly available assessment of a player’s total value.  On the contrary, in my opinion, runs batted in and pitcher wins are the more “established” and traditional statistics used to value players.


I looked at all qualified player-seasons from the Statcast era (2015-2019) and curated two scatter plots - one for pitchers and one for hitters.  To be fair to leadoff hitters, I’ve averaged runs scored and runs batted in. I compared the totals to fWAR, as shown below:


*Please note that this excludes all negative-WAR seasons


There is actually a strong correlation here!  The above chart demonstrates that sabermetricians and traditionalists really don’t have much to disagree on.  The r-squared value effectively states that 55% of run and RBI totals come from some contextual environment such as what runners are on base.  So we can be certain that about half of traditional stat totals come from how good a player actually is.


I’d argue that this is enough to the point where the two opposing factions of invested fans shouldn’t squabble over which stat is better - they say some similar things.  Though I much prefer WAR because it includes defense, baserunning, and is context-neutral, both measures are adequate ways to evaluate hitters offensively.


But what about pitchers?


*Please note that this excludes all negative-WAR seasons


Due to sample bias (only qualified seasons were included), the extreme winning percentages that would actually lower this correlation even more are excluded.  With that in mind, the correlation between pitcher wins and WAR is already a weak one. Jacob deGrom exemplified the discrepancy last year, when he won the NL Cy Young award^ with a 10-9 record but had a sample-leading 9.0 fWAR.


^I would argue that the media coverage of this discrepancy furthered the campaign for his victory


It’s hard for me to defend wins in this case as I did with RBI earlier.  They are so team and offense-dependent to become virtually meaningless. The correlation value gathered from the scatter plot above says that only 18% of a pitcher’s skill and on-field production has actually directly led to his win-loss record.


So, to recap: I believe it’s fair that the analytically-minded community takes issue with the pitcher Win stat due to its remarkably low correlation to performance, but people should calm the argument concerning runs and their batted in statistics because there isn’t as much to fret over.


Make peace, not war.  


But please, use WAR.


May your pennants fly forever.


-Ryan

Edwin Diaz is K-Rod 2.0


With their Edwin Diaz trade looking worse and worse by the day, the Mets seemingly have not learned their lesson from Francisco Rodriguez and the eerie parallels concerning the two careers.


The Rodriguez and Diaz problems are very similar. Two young (24 for Diaz, 25 for Rodriguez) closers from the AL West went to the Mets. Both closers were chasing the single season saves record, which Rodriguez managed to get and hold with 62 saves. Both closers, who had shown flashes of dominance before, were viewed to have finally put it together during the season.


After their stellar 20_8 seasons (2008 for Rodriguez, 2018 for Diaz), they went to the Mets. The Mets signed Rodriguez in free agency and traded for Diaz (also, that Robinson CanĂ³ guy) at the same time. High expectations were placed on the newly-New York closers.  To put it politely, the expectations were not met.


Although Rodriguez managed to make the All-Star Game in 2009, his total performance for the year was not pretty. The 3.71 ERA looks satisfactory on the surface, but the RA/9 of 4.50 with a slightly better defense in a pitchers park resulted in his bWAR being a measly 0.1. He also walked Mariano Rivera with the bases.  Big oof there.


So far in 2019, Diaz has posted an ERA around 5, with his most notable meltdown being blowing a 3-1 lead against the Phillies. He gave up 5 runs in one third of an inning, losing the game. Editor's Note: This wonderful game was also pretty bad. His deal has looked worse by the day, but it should have been clear from the beginning that these deals do not work out.


May your pennants last forever.


-Prentiss

Saturday, June 29, 2019

Can Brandon Workman Keep It Up?


Middle relievers, especially those who are not closers, rarely get any love in the MLB. They are crucial to a team, bridging the gap from the starters to the shutdown ninth inning guy. One such pitcher is Brandon Workman.


Workman is a middle reliever for the Boston Red Sox and is part of a bullpen including Matt Barnes, Ryan Brasier, Marcus Walden and others. Workman was part of the Red Sox's World Series championship team in 2013, then after disappearing for a couple years, made some relief appearances in 2017 and 2018, and finally became a full time piece in 2019. He is, as of June 26th, posting a 1.70 ERA. Workman is allowing a miniscule 3 hits per 9 innings, and an amazing 0.2 HR/9. With his K/9 nearly 13, all should be fine in the land of Workman.


On the contrary, he’s posting a horrendous 6.3 BB/9. He is using his curveball a career high 47.5% of the time, with his fastball and cutter usage declining compared to before. Workman’s swing percentage is hanging around 50%, more than 10% lower than previous years.


Workman is getting fewer swings, and fewer contact on the swings, hovering around the ⅔ mark, again a low. The downside is that Workman’s strike percentage is a horrific 37.9%, a career low. He is simply not finding the zone as often, and although he is not allowing hits, he’s allowing too many walks as well. If batters adjust and do not chase as much, Workman will be in big trouble.


May your pennants fly forever.


-Prentiss

Friday, June 28, 2019

The 50th Anniversary of Gaylord Perry's Moonshot is Approaching


Pitchers, historically, have not been the best hitters. After all, they are signed due to the ability to pitch and not necessarily swing a bat. Some pitchers, however, are below average even for pitcher hitting. Gaylord Perry fits into that latter group.


The righty began his career with the Giants in 1962. Perry, a two-time Cy Young winner with career accomplishments including 300 wins and 3000 strikeouts, was not known for his hitting. He was actually more known for his spitball usage rather than his hitting skills. The story goes that Perry was taking batting practice one day when his manager, Alvin Dark, remarked how “they’ll put a man on the moon before [Perry] hits a home run.”


1969 rolled along, with it being the final year to live up to JFK’s promise to put a man on the moon by the end of the decade. The mound was lowered, the Miracle Mets were playing, American troops were still in Vietnam and Woodstock is coming for the summer. Dark’s quote still rang true and it appeared there was little possibility of that changing, as Perry’s last extra base hit was in 1967. Perry was 30 years old and still going strong as he faced the Dodgers on July 20.


On that same July 20th, NASA had their Apollo 11 mission sent into space and was prepared to land on the moon. Perry was facing Claude Osteen, the 1968 NL leader in losses, and the Dodgers. Run support was most likely not going to be a problem, with the top of the lineup featuring 30/30 man Bobby Bonds, Willie Mays and 1969 MVP winner Willie McCovey.


Perry did not start off strong, giving up 3 runs in the top of the first to Maury Wills, Manny Mota and Wes Parker. Perry later settled down, only allowing a single to Wills in the second, and had a 1-2-3 third inning. Osteen retired the first 8 batters he faced. By now, Neil Armstrong had taken his one small step for man, one giant leap for mankind on the Moon’s rocky surface. And Gaylord Perry had not hit a home run.


Gaylord Perry stepped into the box with 2 out in the bottom of the third to face Osteen, who led the National League in hits given up for 1969 but won 20 games (Editor's Note: pitcher wins don't matter). Perry took an Osteen offering deep and beyond the fences in Candlestick Park. Gaylord Perry had finally hit a home run, coincidentally right after Armstrong stepped on the surface of Earth's moon.


Osteen was clearly rattled by the home run, walking Bonds and eventually throwing the ball away, with Barry's father scoring another run. Perry pitched 8 shutout innings after his disastrous first inning, picking up his 12th win of the year. More importantly, he hit his first home run.

He still lost the bet.

May your pennants fly forever.

-Prentiss

Wednesday, June 26, 2019

Appreciate Fernando Rodney's Arrow


Pitchers are odd little creatures. They have their walk-in music, funky windups; they mess around with physics and have their own little celebrations. Especially closers.  They have some fun celebrations.


They do this thing called save games. They finish the ninth inning in a sorta-close game and rack up this stat called The Save. As long as said closer doesn't blow the lead, they get that save. Anyone can do this. Even 3 innings in a blowout win qualifies. But the important part is how you finish.


Admittedly, closer walk in music is a whole science, determining the right tunes to hype up the crowd. From ACDC's Hells Bells (Trevor Hoffman) to Abba's Dancing Queen (John Smoltz), the whole science of closer music can impact every genre. But a nice walk in song means nothing if you can't close the deal. And how you are after you close the deal is far more important.


Normally what occurs is a little celebration, some handshakes and the occasional fist bump, or - in Dennis Eckersley's case - a pump. Some pitchers decide to remain stoic and show little emotion. But not in the case of Fernando Rodney.


Fernando Rodney is a unique pitcher. From an objectively odd hat tilt to an interesting career trajectory, Rodney is unique. He is well traveled due to one of two reasons. Either teams don't like him to lock him up long term to be a closer, or teams fight over the arrow.


Rodney has fired his arrow after every save, or sometimes when he gets pulled. The Arrow is the sign to celebrate, that Rodney has done his job. The team has won, and Rodney finished the game. Though the celebration is widely known in baseball circles, Rodney is the sole pitcher to use it.


Please note that the following italicized portion follows the highest of journalistic standards:

The Arrow is irresistible for MLB teams. Rodney travels year to year because every team wants him, and Rodney wants everyone to experience the power of his archery skills. Teams reportedly fight over him at the trade deadline, according to sources such as Theo Epstein, Terry Francona and many others. During the trade deadline (according to the aforementioned), teams reportedly send an intern each to a Hunger Games-style simulation to determine who will get Rodney. Of course this very well may be false, but is far more interesting than the reality: Rodney is a mediocre pitcher.


Fernando Rodney was just called to the majors by the Nationals.  Hopefully we'll see even more archery in the future.

May your pennants, and arrows, fly forever.


Image result for fernando rodney arrow

-Prentiss and Ryan

Tuesday, June 25, 2019

Brad Keller is Moving Away From his Fastball, with Mixed Results


Royals rotation leader (not ace) Brad Keller has experienced some struggles this year. Keller was expected to build off his debut of a 3.08 ERA in 140 innings in 2018, but he has been struggling as of late. (All Stats are excluding his start on June 24, 2019)


Keller is using his fastball 63.9% of the time, much lower than the 69.7% usage rate he posted last year. The usage has impacted his 4 seam usage far more than his sinker, as Keller only uses his sinker one less pitch per every hundred compared to last year. His 4 seam usage has dropped from 44.3% to 39.3%, which is quite drastic. His velocity has slipped concerning all of his pitches, but the change is negligible at best, maybe 1 mph at most.

Keller is using his offspeed pitches more, but not his changeup. His changeup usage declined from 4.1% to 1.9%. One of Keller’s rarer offerings is now a pitch that hitters do not have to worry about: the slider. He is using it 34.2% of the time compared to 26.2% last year. So what are the results?


Image result for brad keller

Keller, this year, is getting fewer swings on pitches outside the zone, fewer swinging strikes and more contact against all of his pitches (the contact has been harder, too). He is in the strike zone 38.6% of the time, compared to 40.8% in his breakout 2018 season. As a whole, Keller’s peripherals are declining. But does this usage bring any benefit?


Image result for brad keller

The Royals righty has only given up 4 home runs this year, and has a 0.4 HR/9, one of the best of those figures in the league. However Keller has walked 46 batters already this year, one of the worst totals in the league. His lack of command leads to more baserunners and runs given up in general. Keller might need to change his approach and focus on commanding his slider better, or varying the sequencing of his pitches.

May your pennants fly forever.

-Prentiss

Monday, June 24, 2019

Fiers on Fire Since No-No


Mike Fiers managed to pitch the first no hitter of the 2019 season, and the second of his career, joining luminaries such as Justin Verlander, hall of famer Roy Halladay, and Homer Bailey. Since then, Fiers has been much better for the Oakland A's.


Fiers started off the season with several up-and-down performances, with his April 7th performance against the Astros, the team Fiers threw his first no hitter for, marking the beginning of the stretch of bad games culminating with a 3.1 inning, 6-run start on April 20th, raising his ERA to 8.28, the highest of the season excluding the one game sample after opening day. Combined, his next 2 starts were 12 innings and 5 runs, barely satisfactory performances. On May 7, Fires threw his no hitter against the Cincinnati Reds and began to heat up.


Few thought Fiers, with his 6.81 ERA pre-No Hitter, could keep up his performance. But, magically, he did. Since (and including) May 7, Fiers has been on a hot streak. With a 66% strike rate, Fiers has only allowed 10 extra base hits. The former Tiger has posted a 2.51 ERA and has not lost a game. Posting 32 strikeouts to only 15 walks has helped make Fiers one of the A's best starters during this time. Will he keep it up?

May your pennants fly forever.

-Prentiss

Saturday, June 22, 2019

Tommy Kahnle is Back


The Yankees traded for Tommy Kahnle during the middle of the 2017 season to strengthen their super-bullpen. Kahnle did exactly as he was expected to do, finishing out 2017 as a reliable reliever for New York. However, his 2018 season did not go as planned, and there were calls from fans and the media to cut him.


The Yankees were Kahnle’s original team. Although he never appeared in a major league game with them, Kahnle was drafted in the 5th round of the 2010 draft and spent several years in their minor league system. Sensing his promise, the Colorado Rockies scooped him up in the Rule 5 Draft and the righty made his MLB debut on April 3, 2014. After 2 years and 102 innings of 100 ERA+ relief pitching, they traded him to the White Sox after the 2015 season. Kahnle put in one and a half solid years for Chicago, who eventually traded him to the Yankees during summer 2017. Kahnle posted a 2.70 ERA for the Yankees through the remainder of the 2017 season. In 2018, though, the wheels fell off the wagon.


Kahnle lost more than 3 mph off his fastball, and that combined with batters not biting on his offerings, and being unable to find the strike zone compared to previous years, with his strike percentage down by 6, batters were able to hit Kahnle harder: he allowed a 16.1% soft contact rate, while his medium contact rate went down and his harder hit contact went up. His K-BB% dropped by 10%. This all led to a 6.56 ERA in the majors for the Yankees in 23.1 innings. He did not fair much better in the minors, posting a 4.01 ERA for the Yankees’ AAA affiliate.


This season, Kahnle is posting a 2.70 ERA, inflated by a disastrous 1 inning, 4 run appearance against the Indians on June 9. His fastball velocity is back up around 97 mph, and his slider usage has dropped, favoring his changeup a career high 42.3% of the time. Batters are swinging 7% more often than against him last year, while contact against his pitches is down 1.3%. Kahnle is now able to find the zone roughly half the time, compared to only 45.7% last year.


So while much of the credit for the Yankees’ bullpen dominance may go to Aroldis Chapman, Zack Britton and Adam Ottavino, Kahnle’s improvement is also a major reason why the unit has been successful.


May your pennants fly forever.


-Prentiss

Tuesday, June 18, 2019

Justin Verlander is a Car Commercial

Riddle me this: what makes a marketable car?  What many of us often hear in commercials are varying aspects of the following:


Speed.


Durability.


Consistency.


Awards.


Improvement upon past models.

Image result for car commercial generic


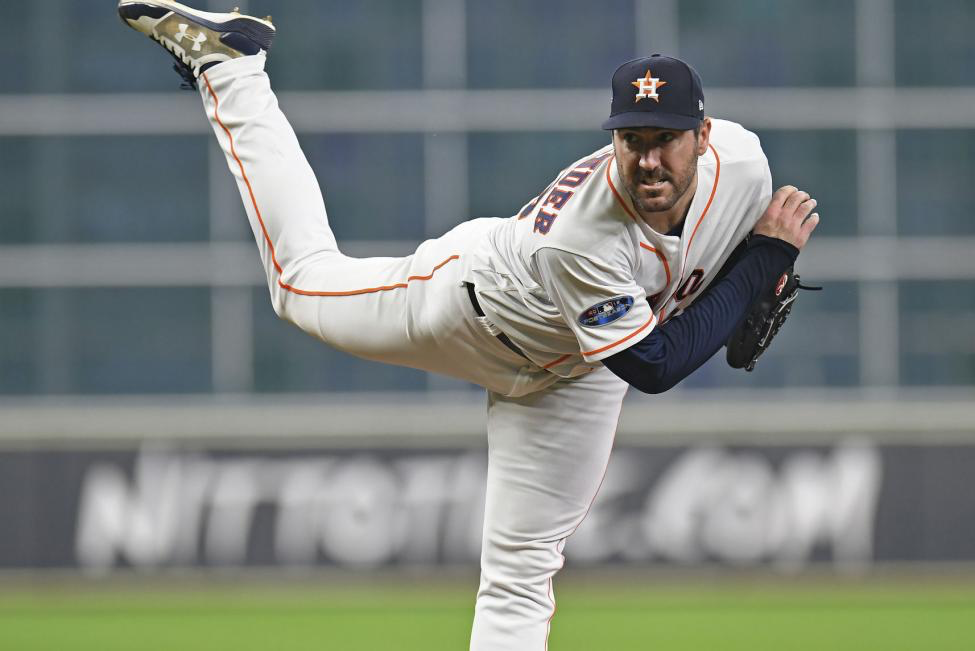
You’ve read the title of this piece, so you know who I’m going to be writing about.  Hopefully you’ve heard of Justin Verlander, or even better, know of his pedigree.


I’m going to go over the aforementioned car commercial tropes and apply them to our friend JV, so roll down your windows and enjoy the ride!


Speed


Though velocity is certainly not everything that a pitcher needs to succeed at the major league level, it is undeniably an important aspect of getting hitters out.


Justin Verlander has been pitching in the major leagues full-time since 2006.  Over that period, the righty has averaged approximately 94.4 miles per hour on his fastball compared to the Major League average of ~91.2 miles per hour among his fellow starting pitchers.  Clearly, Verlander is special when it comes to throwing a baseball as fast as humanly possible.

Image result for baseball radar gun

To prove that point, Verlander ranks fourth (minimum 1000 innings) in fastball velocity behind Chris Archer, Stephen Strasburg  (of whom Prentiss wrote about here), and current teammate Gerrit Cole in four-seam velocity.


Durability and Consistency


Pitchers break a lot, of course.  After all, it’s not very difficult to hurt your arm or another part of your body when trying to generate the velocities needed to have a chance at a professional career.


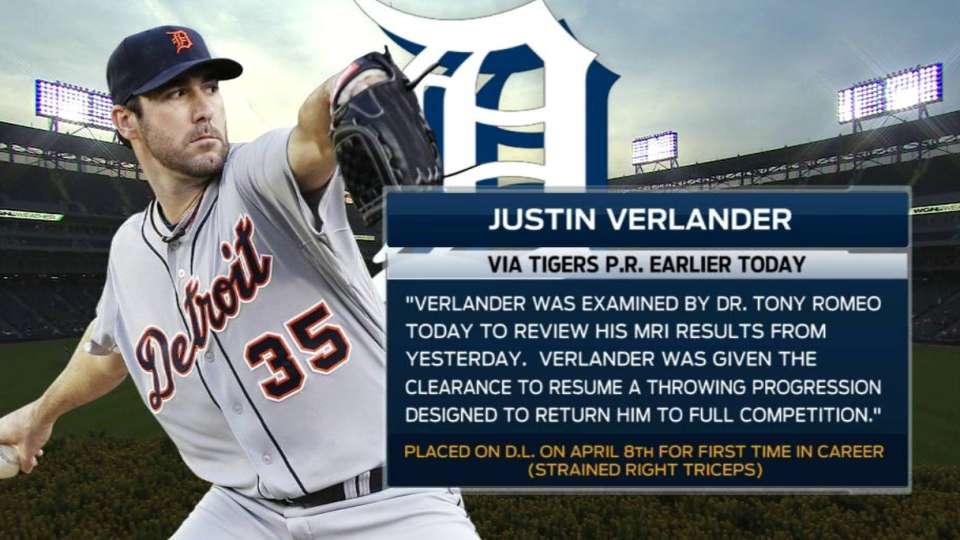
Justin Verlander has been remarkably unbreakable over the course of his storied career.  He’s only made one trip to the Disabled/Injured List over his entire career; it was for a bit over a week.


Seriously, think about that!  Over 14 full seasons, Verlander has missed only a few starts as a result of not being on the roster.  Now, that’s deceiving because the fireballer missed 12 starts in 2015 due to an oblique injury and corresponding surgery.

Image result for verlander injury


Even with 2015 being taken into account, Verlander has missed just 42 starts over his 14-year career if we generously assume a baseline of 34 starts a year.  Therefore, the hurler has missed just 3 starts per season. That’s incredible considering how hard he throws and how much he’s thrown over the years.


Now, being an innings-eater for a team is useful but not extraordinary.  If a pitcher made 34 starts per year but has an ERA in the 5s every season, he would only be useful on a rebuilding team.  That, of course, is not Justin Verlander.


Among qualified American League starting pitchers, Verlander has ranked 11th or better in terms of ERA every season besides 2008 and  his 2013-2015 stretch of being “only” above league average. That’s 10 seasons of dominance and 4 seasons of serviceability, which is anything but inconsistency in my mind.


Even better: Verlander has averaged nearly 5 WAR per season over his career, and that does not even account for the fact that 2019 isn’t even halfway over yet.  This guy is just amazing.


Awards


Though I tend to ignore awards and look at the raw data available to determine the legacy of a player, I think it’s important to talk about the accolades that Justin Verlander has collected over his career.  The fact that this section perfectly fits my car commercial theme doesn’t hurt either.


Shall we begin with the tour around Verlander’s trophy case?


2006: Rookie of the Year
2007: All-Star, top 5 in Cy Young voting, top 20 in MVP voting
2009: All-Star, top 5 in Cy Young voting, top 20 in MVP voting
2010: All-Star
2011: All-Star, Cy Young, Most Valuable Player
2012: All-Star, top 5 in Cy Young voting, top 20 in MVP voting
2013: All-Star
2016: Top 5 in Cy Young voting, top 20 in MVP voting
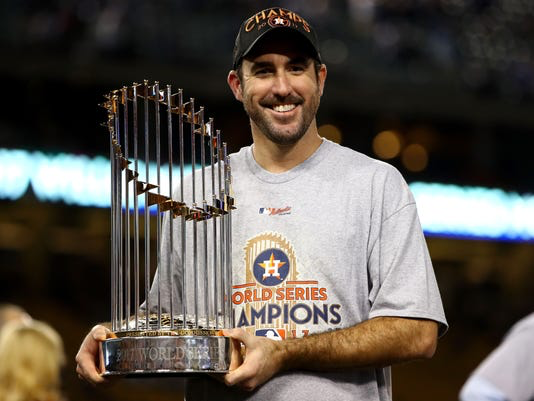
2017: World Series Ring, top 5 in Cy Young voting, ALCS MVP
2018: All-Star, top 5 in Cy Young voting, top 20 in MVP voting


(Thanks to Baseball Reference (https://www.baseball-reference.com/players/v/verlaju01.shtml)  for making that easy, by the way.)


So...not too shabby!


Improvement


If a perspective car customer wasn’t convinced by the unrealistic scenery and impressive specs on a certain car, companies typically promise that the new model of the certain car is markedly better than previous models.


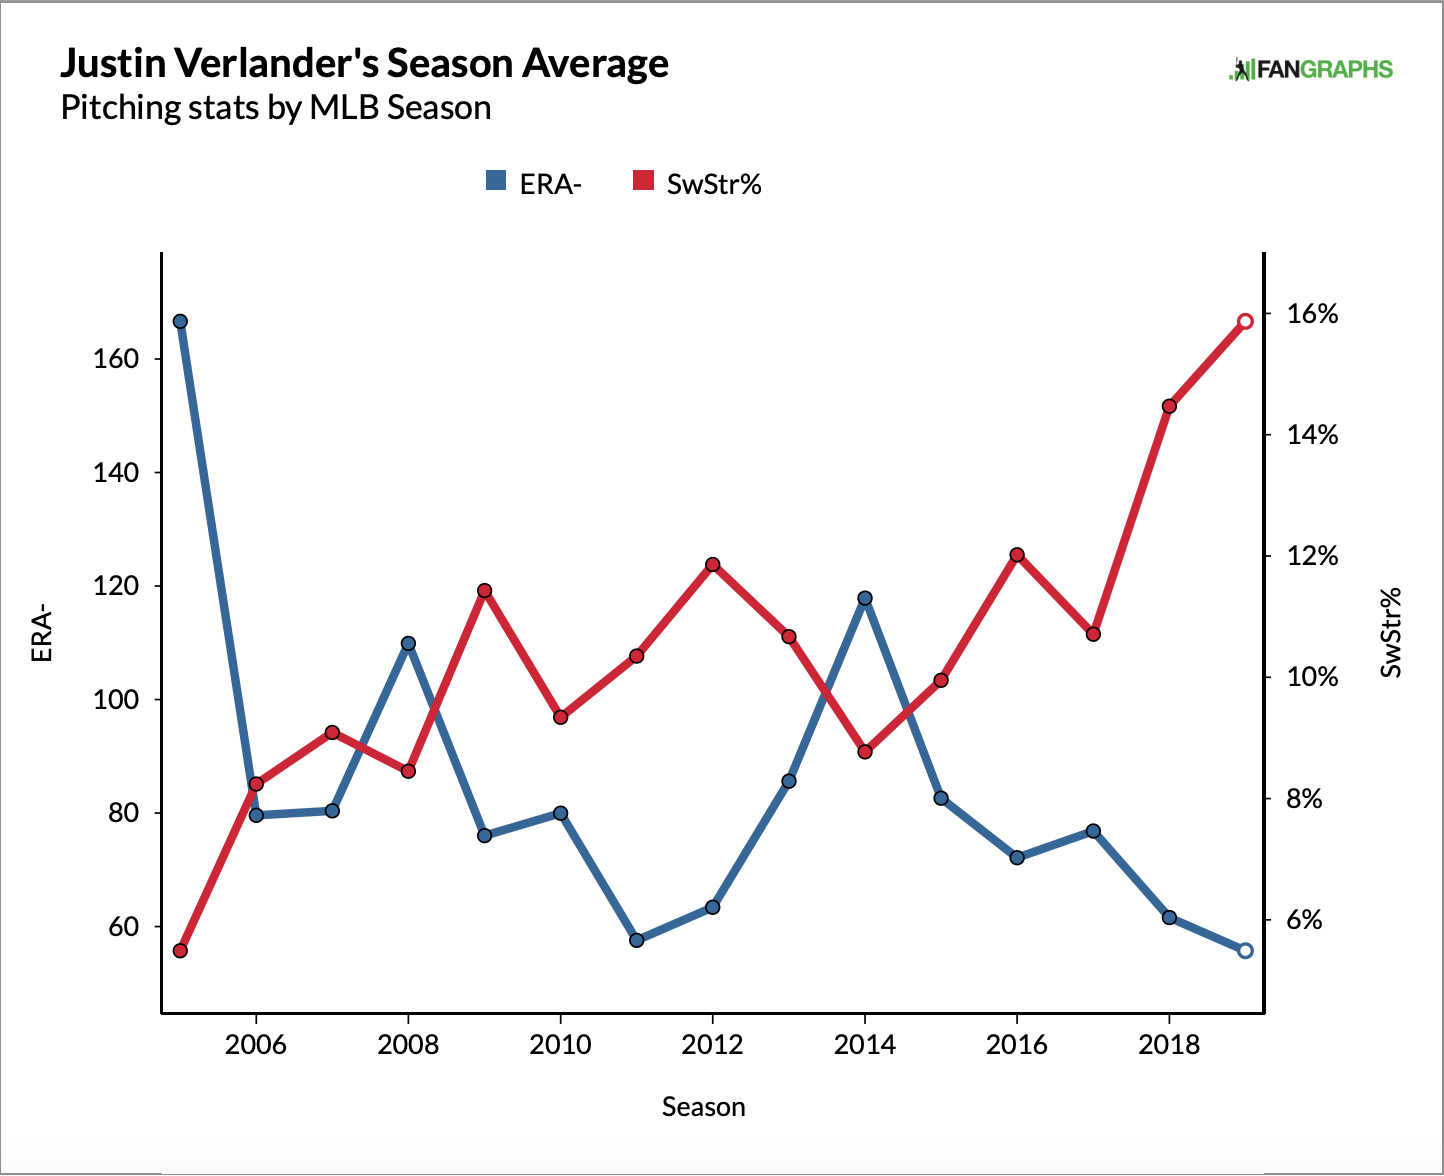
Though he has never truly recaptured his 2011 brilliance, Verlander has steadily improved since his 2013-2015 mediocrity in an impressive fashion.  Firstly, let’s look at his ERA- and whiff percentage over the past five seasons as to get a sense of quality.


There’s a clear increase in whiff percentage and correlating decrease in ERA since 2014 - exactly what we want.


How has Verlander improved so much, despite his age?  Several articles have been written on the subject recently (here, here, and many more), so I’ll primarily just be restating prior conclusions.


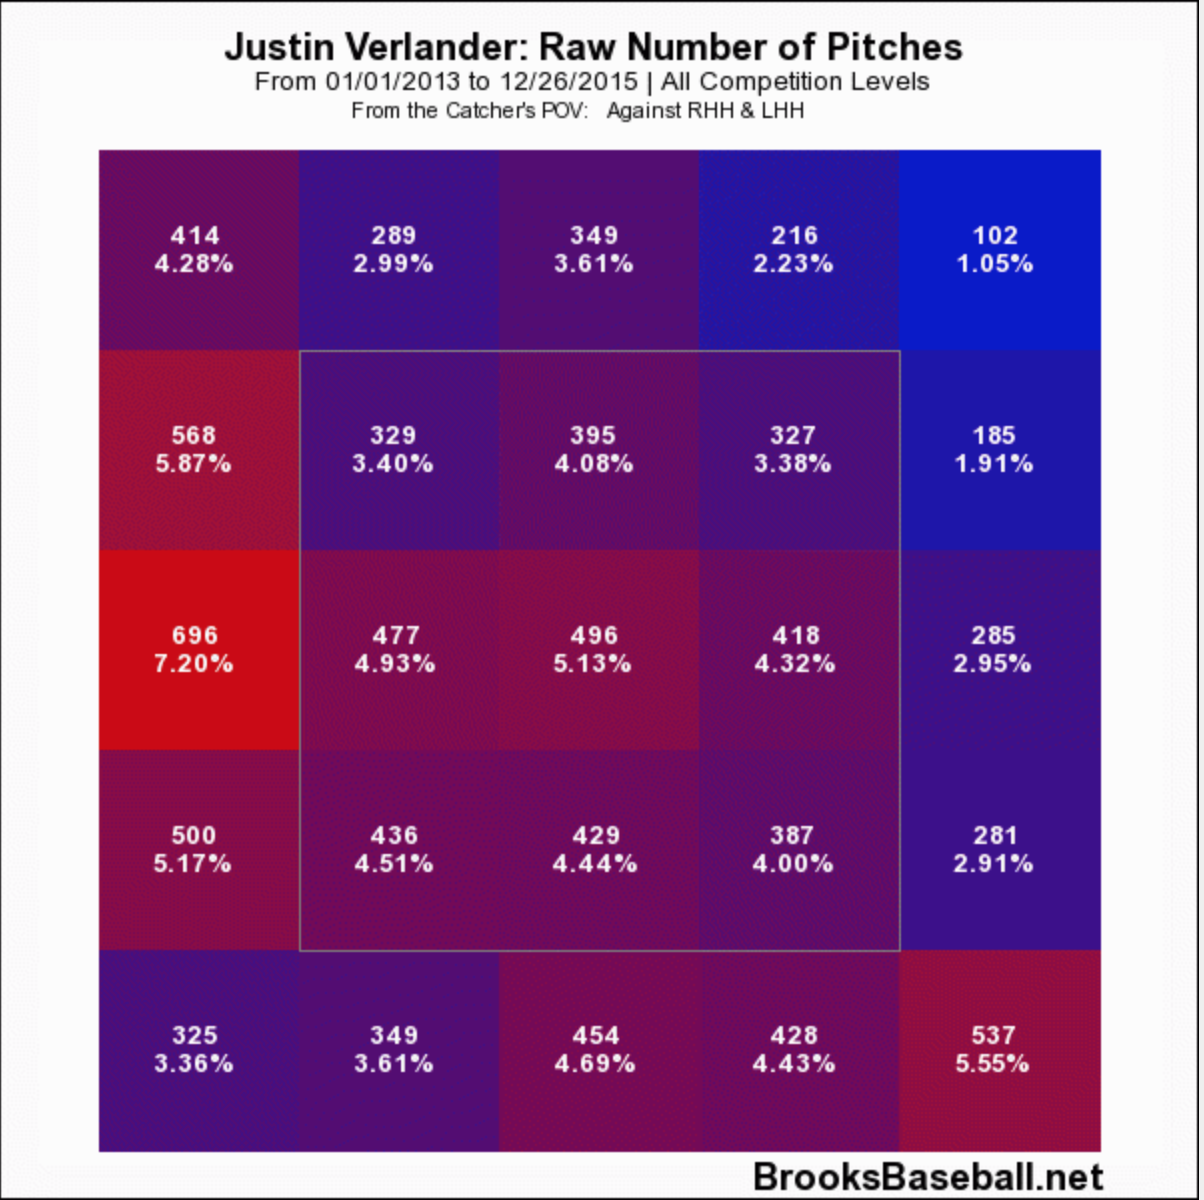
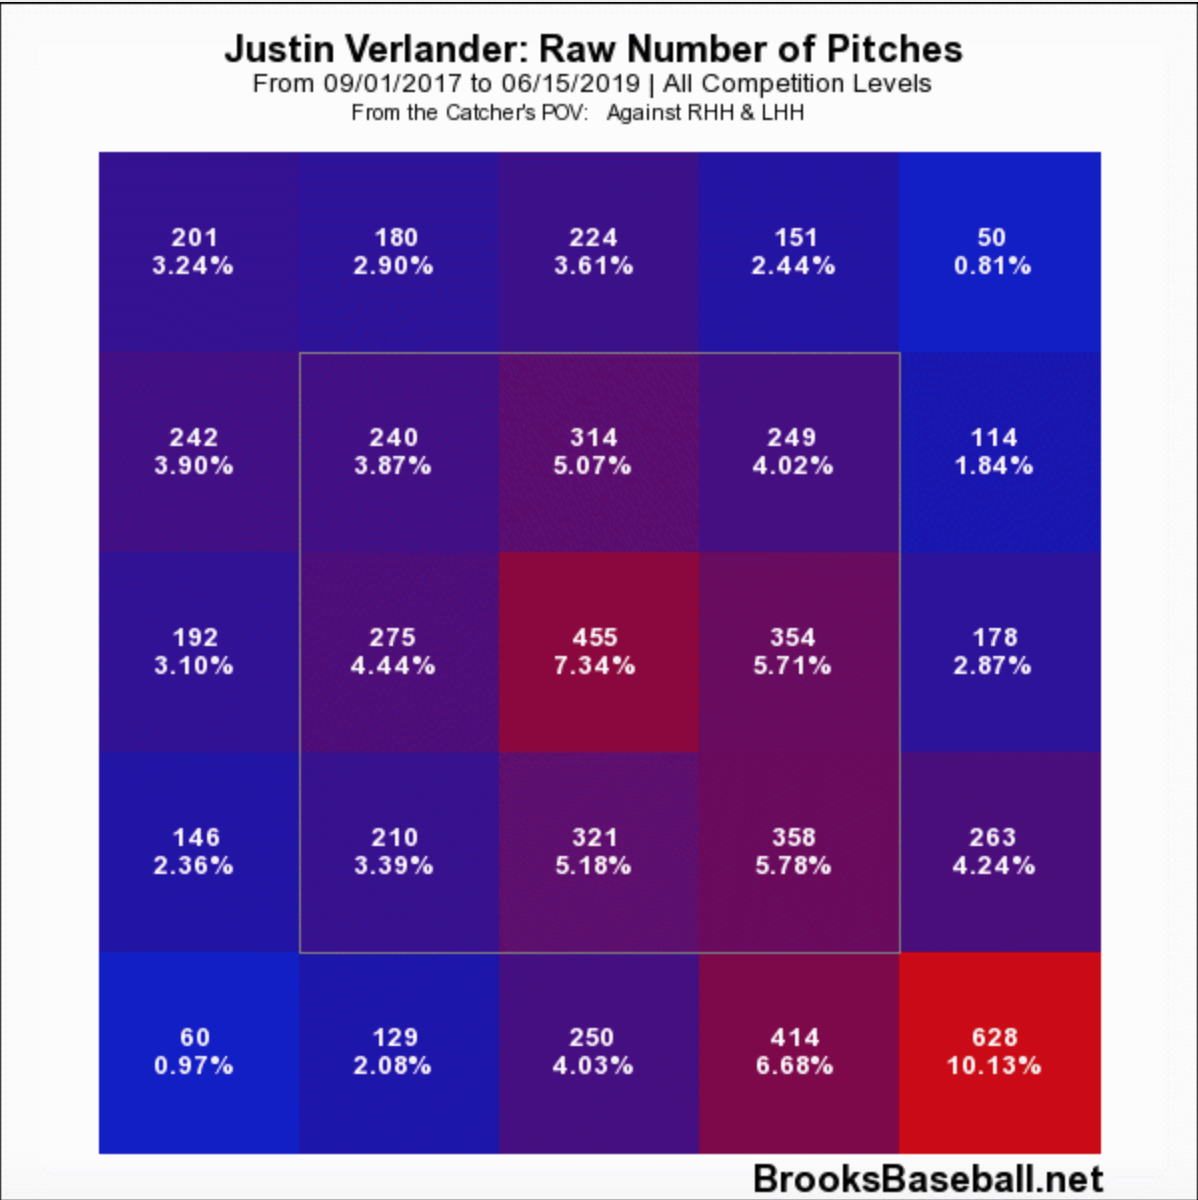
The Astros are famous for enhancing high spin rate fastball-curveball combinations, from Collin McHugh to Ryan Pressly. A similar change, though less drastic, appears to have occurred with Verlander’s fastball and curveball, but interestingly the effect is even stronger when it concerns Verlander’s slider (his primary secondary pitch).  What JV has also improved since his rough patch is the command of his pitches:


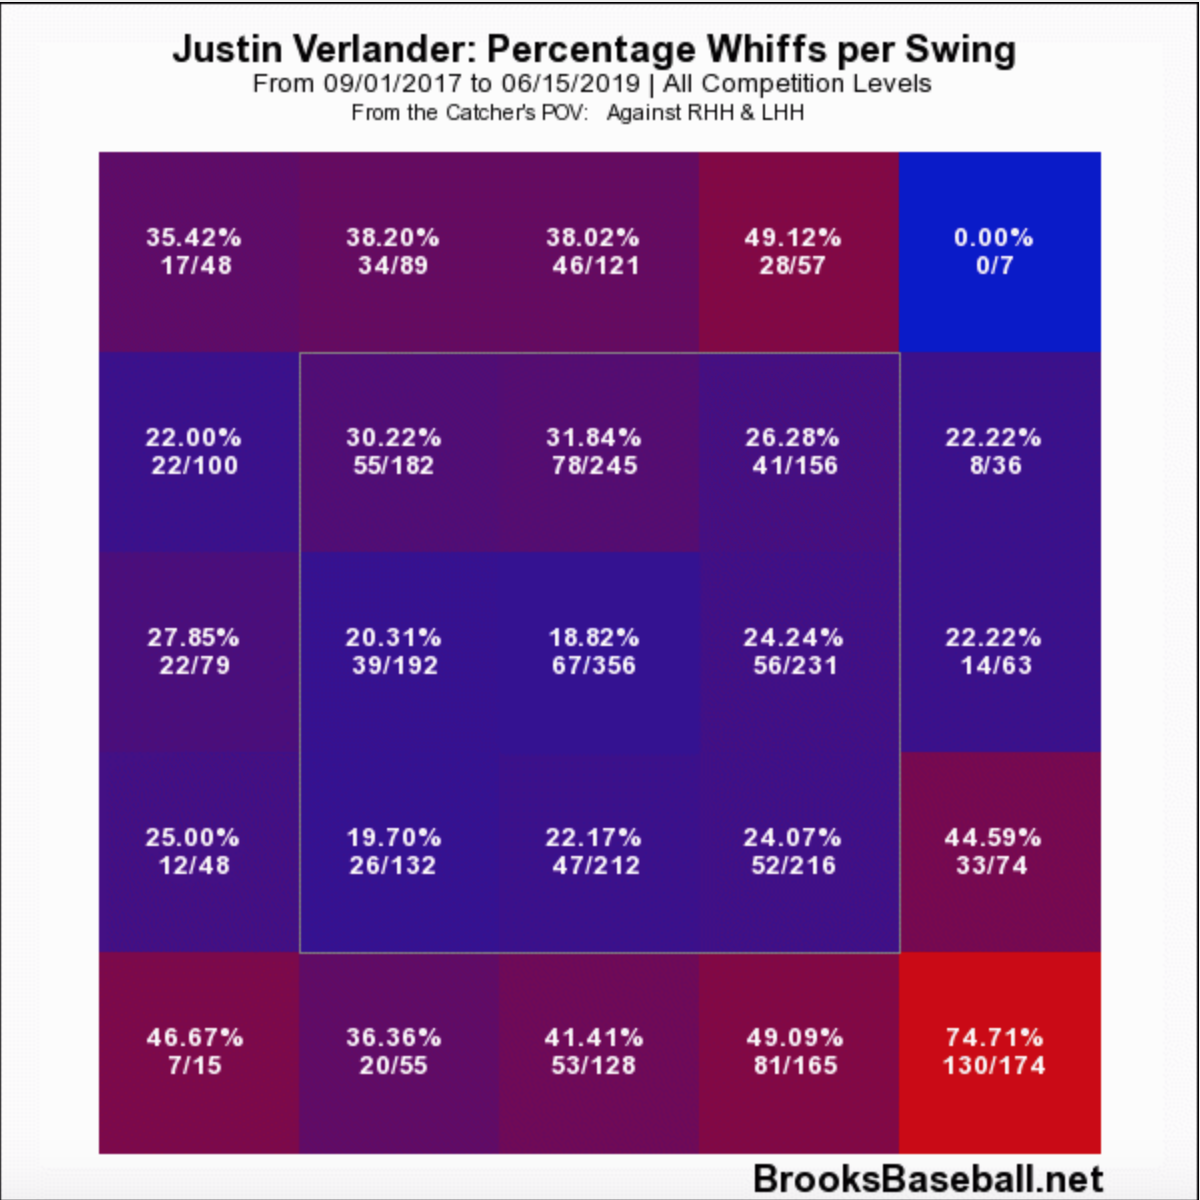
As shown in the zone profiles above, Verlander is throwing more pitches down and away (to righties; down and in to lefties), where he gets the most swings and misses, and fewer pitches inside (to righties; outside to lefties) where he gets a relatively low amount of whiffs:


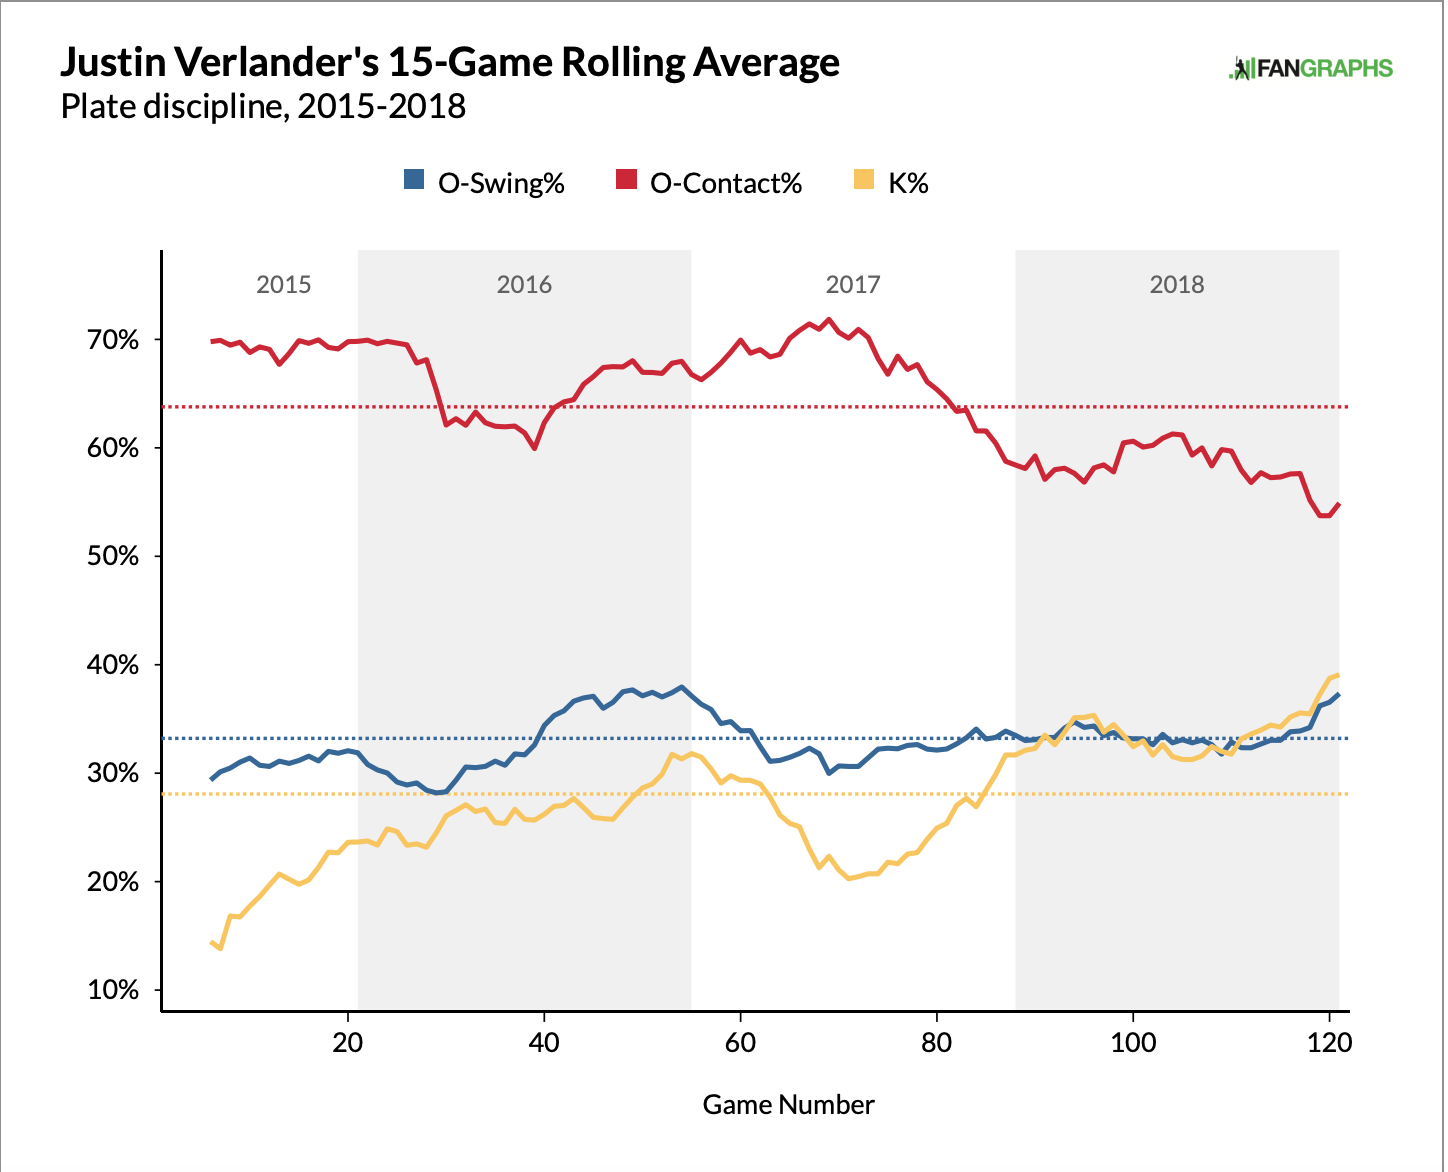
The combination of higher spin rates (and the accompanying increase in pitch movement) and throwing pitches where batters are likeliest to swing and miss causes those poor hitters to chase more.  What makes those chases even better? Verlander is inducing less contact on pitches outside of the zone:


What the aforementioned shows is that Justin Verlander has proven that he can improve even while common sense about aging athletes introduces the contrary into our minds.


The Commercial


Justin Verlander can brave any terrain and can go thousands of innings without needing an oil (ligament) change.  He’s won awards from experts and is even better than before...somehow. His fastball might be the most aesthetically pleasing and most effective in the world, so come to a ballpark near you every fifth day and lease the kinda-new and vastly improved 2019 Justin Verlander for only thirty-three million dollars a year.


It’s a limited time offer, but that offer sure has lasted a long time.


May your pennants fly forever.


-Ryan